library(ggplot2) How I made my R Ladies Map
This week I am curating the We are R Ladies account on Twitter and I wanted to make my R Ladies map on which I show each R Ladies chapter that I have given a talk for and also my home chapter. Since the United States and Turkey are far away from each other I wanted to make two separate maps.
Getting Ready to Map
There are many packages for spatial data in R but I did not need anything too complicated and I started with ggplot2.
For each R Ladies chapter I compiled the data for latitude and longitude of the locations. I also used R Ladies logo in the maps so I included the image url in the tibble as well. The name of the tibble is places.
location <- c("Columbus", "Sarasota", "New York City",
              "Miami", "Irvine", "Istanbul", "Ankara", "Eskisehir")

lat <- c(39.961178, 27.336483, 40.713054,
         25.775084, 33.685908, 41.00824,
         39.927232,39.768856)
lon <- c(-82.998795, -82.538602, -74.007228,
         -80.194702, -117.824719, 28.978359,
         32.851977, 30.521647)

rladies_logo_url <- "https://raw.githubusercontent.com/rladies/starter-kit/f2604d29d73101904ea7b247e5d72ad7f5adaa8f/logo/R-LadiesGlobal_CMYK_offline_LogoOnly.svg"

image <- rep(rladies_logo_url, length(location))


places <- tibble::tibble(location = location,
                 lat = lat,
                 lon = lon,
                 image = image)
Getting Maps
I wanted to get the simplest map so borders() was good enough for me. I made one for the United States and one for Turkey.
us_map <- ggplot() +
  borders("state",
          fill = "lightsteelblue")

us_map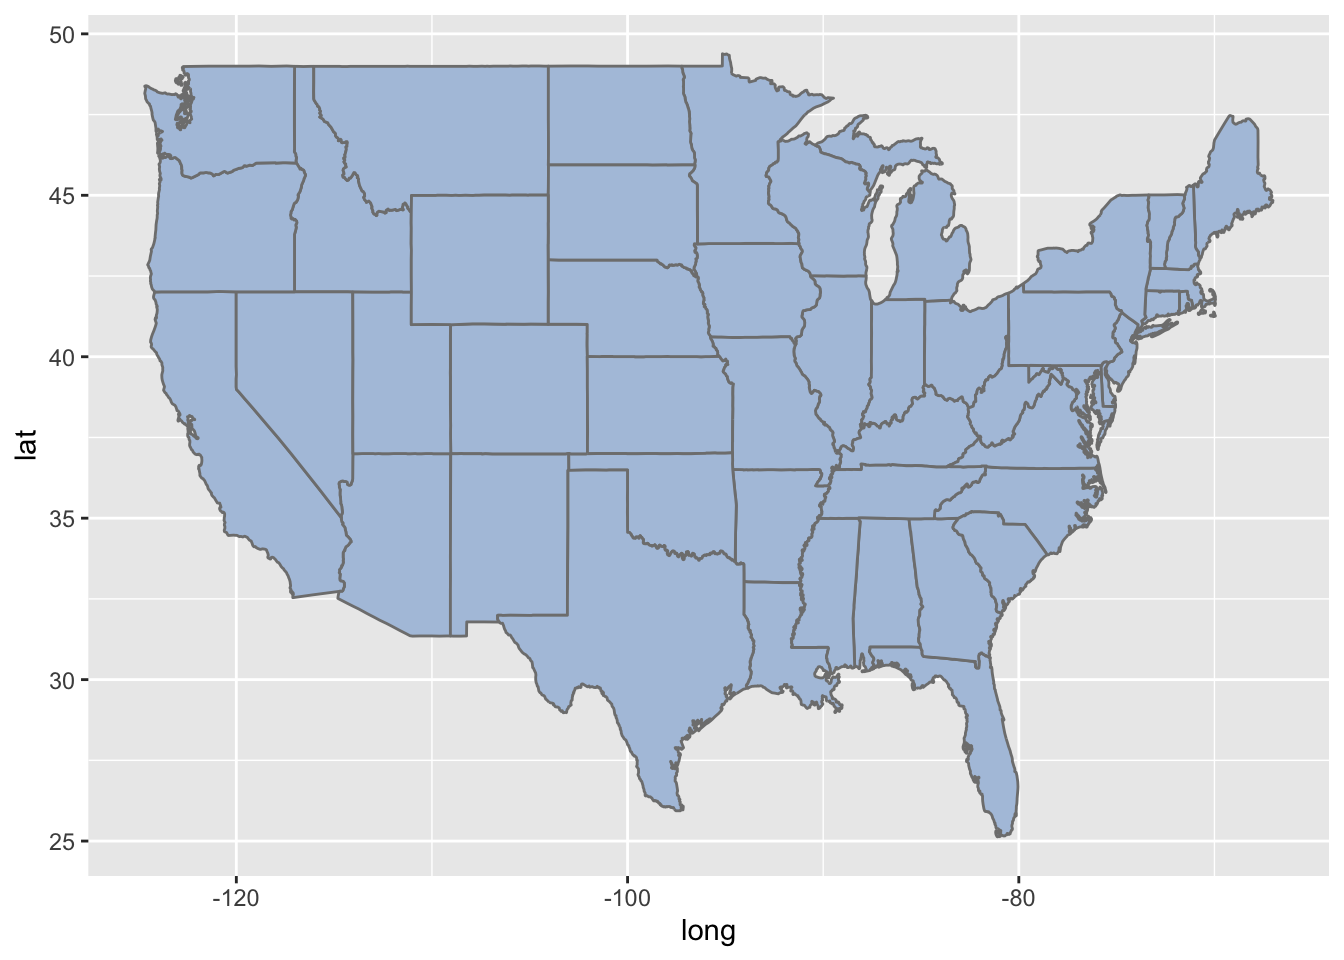
tr_map <- ggplot() +
  borders("world", "turkey", fill = "lightsteelblue")

tr_map
Adding R Ladies Logo
Using the places data, first I separated the places in the US and Turkey. I use the fact that Turkey is to the east of the prime meridian and the US is to the west.
us_places <- dplyr::filter(places, lon < 0)tr_places <- dplyr::filter(places, lon > 0)I wanted to add the R Ladies logo to the map but I was not sure how to do it.
If there is a will there is
a wayan R function.
Using the ggimage package I added a new layer with geom_image() to both of the maps.
us_map <- us_map +
  ggimage::geom_image(aes(x = lon, y = lat, image = image), data = us_places)
tr_map <- tr_map +
ggimage::geom_image(aes(x = lon, y = lat, image = image), data = tr_places) Lastly I removed the grid and the axes.
us_map + theme(panel.grid = element_blank(),
        axis.title = element_blank(),
        axis.text = element_blank(),
        axis.ticks = element_blank(),
panel.background = element_blank()) 
tr_map + theme(panel.grid = element_blank(),
        axis.title = element_blank(),
        axis.text = element_blank(),
        axis.ticks = element_blank(),
panel.background = element_blank()) 
No matching items